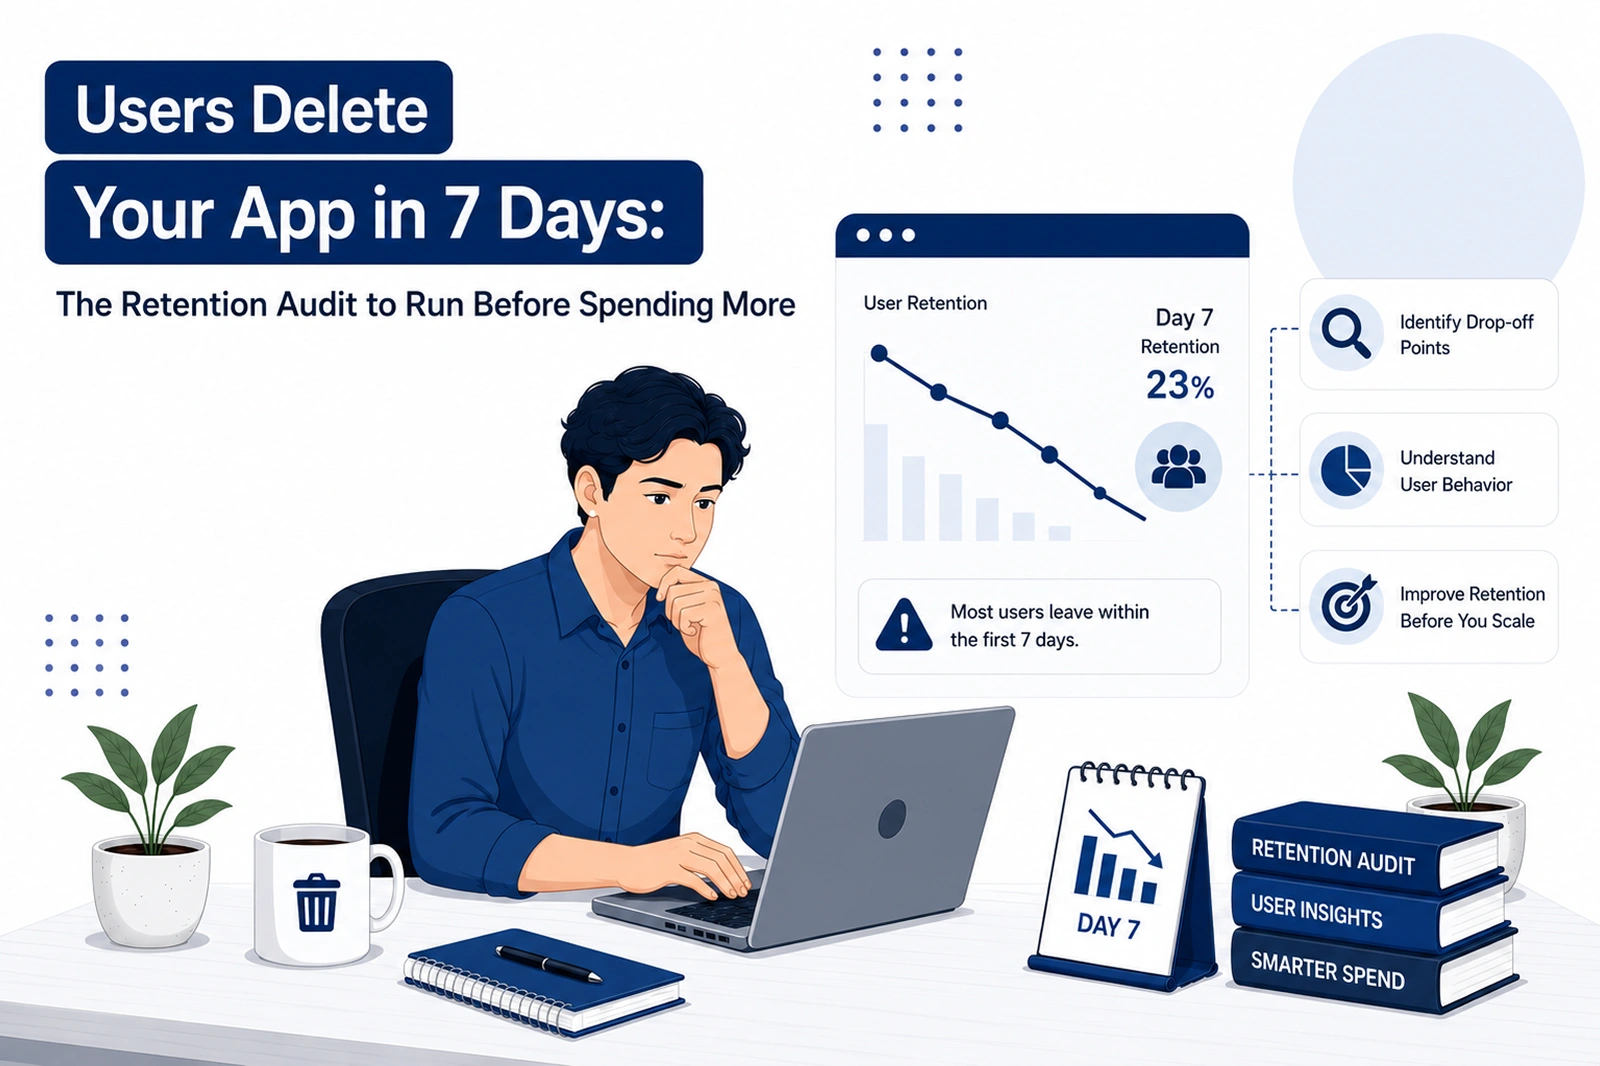
A mobile app retention audit is a structured review of why new users stop opening an app during its first week, run before any additional spend on installs. It covers first-session behaviour, permission prompts, crash and ANR data, notification patterns, and written user feedback. The output is a ranked list of fixes ordered by evidence.
Here's the position I'll defend: if people delete your app by day 7, buying more installs makes the problem more expensive rather than smaller. The hole in the bucket is rarely the missing feature from the roadmap meeting. It's a permission dialog on the launch screen, an eleven-second cold start on the phone half your users own, or a signup form between a stranger and what they came for.
the cold start Android vitals counts as excessive
the user-perceived ANR rate Google treats as bad behaviour
checkpoints that only mean something once you split them by segment
What does app retention actually measure?
Retention measures the share of users who return to an app a set number of days after install. D1, D7, and D30 are the usual checkpoints. A single blended number averages across acquisition sources, devices, and countries, which hides the specific segments that are failing.
The blended number is the problem. Most retention conversations reaching my desk at Shanti Infosoft open with one figure attached to a media-spend question. Organic installs from someone who searched your category behave nothing like a rewarded-install cohort, and in one bucket the healthy half carries the sick half past the point anyone notices.
Split by acquisition source first, then device tier, OS version, country. If D1 for one paid channel sits far below the rest, that's a traffic-quality problem, and onboarding polish won't touch it. Can't produce that split? That's finding number one.
What happens in the first session, and why does it decide the week?
The first session decides most of week one. Two measurements carry it, plus one design decision: cold start time, time-to-first-value, and how much the app demands before it delivers anything. Cold start is the delay from tap to a usable screen. Time-to-first-value is the gap between launch and the first useful thing the user came for.
Measure both on the wrong phone deliberately. A mid-range Android, throttled data, cold cache. Not the flagship on office wifi. Android vitals counts a cold start of 5 seconds or longer as excessive, with warm at 2 seconds and hot at 1.5, and the load-time-to-abandonment link we broke down in how Core Web Vitals move revenue bites harder on mobile, where the user has an uninstall button instead of a back button.
Then count the gates between launch and first value: splash, tutorial, signup, OTP, permission prompts, paywall. None is mandatory unless the app can't run without it. A signup wall on screen one turns a curious stranger into a deleted icon.
When should your app ask for permissions?
Permissions should be requested in context, immediately after a user action that needs them, with a plain sentence explaining why. Requests fired on launch, before any value is delivered, get denied at high rates. On iOS the notification prompt is effectively one-shot, so a denial there is close to permanent.
The common failure is the double-tap disaster. The app opens and, before a pixel of content loads, asks for location, then notifications. Two dialogs, zero context, from software the user has known four seconds. Of course they tap no. Then the growth team wonders why push reactivation is flat.
Ask later. A delivery app shows restaurants first, then offers "use my location" on the tap that needs it. If you must prime, use your own screen, so a "not now" costs nothing permanent. Any permission asked before first value is a bug.
How much of your churn is crashes, ANRs, and devices you never tested?
Crash-free user rate and ANR (Application Not Responding) rate are the two hard numbers, available in Play Console's Android vitals and in Xcode Organizer or App Store Connect for iOS. Both need a per-device and per-OS-version breakdown. Global totals hide failures concentrated in one manufacturer, one chipset, or one memory tier.
Google's published bad-behaviour threshold is 0.47% of daily active users hitting a user-perceived ANR across all devices, or 8% on any single device model, and crossing it makes the app less discoverable on Play. Sort crashes by affected users inside your top three install countries, not by global count. A crash on the sixth most common device in India outranks one on a flagship nobody in your base owns.
The device tail is where audits get uncomfortable: OEM skins that kill background services, low-RAM phones that terminate your app mid photo-upload. Some of it traces to a stack decision made years ago, which is why the trade-offs in our Flutter vs React Native vs native comparison matter to retention. Buy three cheap phones. Emulators lie about memory pressure.
Where's the line between a useful notification and an uninstall?
A useful notification is tied to something the user did or asked for, arrives in their local timezone at a reasonable hour, and leads somewhere specific when tapped. An uninstall-triggering notification is broadcast to everyone, sent on the marketing calendar rather than on user behaviour, and offers no per-type controls.
Track notification-attributed opens against opt-out and uninstall rate, split by campaign type. Most teams measure the first and ignore the other two, which is how a campaign that "performed well" quietly costs you a slice of the base each time it runs.
The 3 a.m. push is the one I'd kill first. A send scheduled for 7 a.m. IST lands in the middle of the night for a user in London, and waking someone up is a memorable way to get deleted. Give people category toggles. Opt-outs rising means it's working.
What do app reviewWhat do app reviews and support tickets tell you that analytics can't?s and support tickets tell you that analytics can't?
Analytics records what users did. Reviews and support tickets record why they stopped and what they expected instead. Written feedback carries device models, network conditions, reproduction steps, and the user's own words at the moment of abandonment. None of that exists as an event in a dashboard, however well instrumented the app is.
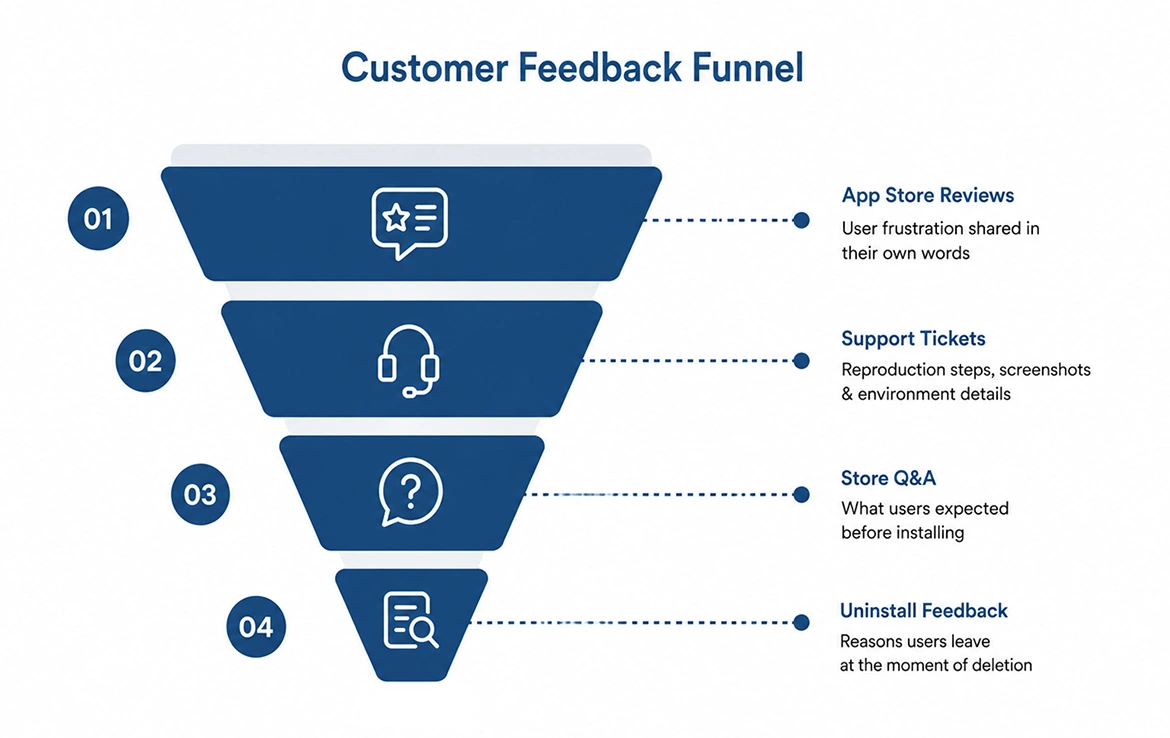
| Signal source | What it reveals | What analytics misses |
|---|---|---|
| 1-2 star app store reviews | The moment of abandonment in the user's own words, with device and OS attached | Intent and emotion behind a drop-off event |
| Support tickets and in-app chat | Reproduction steps, screenshots, account state, carrier and network details | The environment surrounding a failure |
| Store listing Q&A and pre-install questions | What people expected the app to do before installing | Expectation gaps created by the listing, not the app |
| Uninstall surveys and offboarding prompts | A stated reason at the moment of deletion | Uninstall events with no reason attached |
| Competitor reviews | Which gaps push people to alternatives, and which of theirs you can win | Anything happening outside your own telemetry |
| Sales and CS notes (B2B apps) | Procurement, admin, and rollout blockers | Churn causes that aren't product at all |
Mining it is unglamorous. Export ninety days of 1-3 star reviews, tag each against a theme taxonomy, then line the dates up against your release history. Spikes starting the week after a release are your answer.
Read a hundred yourself before trusting a sentiment tool. It clusters forty as "app is slow" and loses the one saying the OTP never arrives on a specific carrier. That one outweighs the other thirty-nine.
What does the retention audit look like as a checklist?
The audit runs twelve steps across analytics, device testing, and written feedback. Budget about a week for one person with access to the analytics account, both store consoles, and the support inbox. Complete every step before deciding what to fix, because the ranking method depends on findings from more than one source.
- Split D1, D7, and D30 by acquisition source, device tier, OS version, and country.
- Measure cold start at p50 and p95 on a mid-tier device, cold cache, throttled data.
- Time the path from launch to first real value, in seconds and taps.
- List every gate before that value; mark each mandatory or skippable.
- Log the order of every permission prompt, with its grant rate.
- Pull crash-free user rate and ANR rate by device model and OS version.
- Rank crashes and ANRs by affected users in your top three install countries.
- Export ninety days of 1-3 star reviews; tag against a fixed taxonomy.
- Export support tickets for the same window; tag with the same taxonomy.
- Map notification sends against opt-outs and uninstalls, by type and hour.
- Compare the store listing screenshots against what the first session delivers.
- Run first launch on a factory-reset mid-tier phone, noting every point you'd quit.
Step twelve finds what the other eleven miss. Do it last.
How do you turn findings into a roadmap ranked by evidence?
Score every finding on three axes: evidence strength, reach, and effort. Evidence is how many independent sources confirm it. Reach is the share of new users who hit it. Effort is engineering days. Rank by evidence multiplied by reach, divided by effort. Highest score ships first.
Keep the evidence scale short. A 1 means one person believes it, including you. A 2 means one data source shows it. A 3 means two independent sources agree and you've reproduced it on a real device. Anything scoring 1 goes to a list labelled "hypotheses", whoever suggested it.
Reach comes from the segment work in the first section, not a guess. Effort needs a real number from whoever builds it, including QA and the release cycle; our 2026 mobile app development cost guide frames what a two-week fix block runs to. The result is usually anticlimactic. Fixing an OTP timeout beats the redesign someone has lobbied for since March.
What should you fix before you spend another currency unit on installs?
Fix anything that breaks the first session for a measurable share of new users: crashes and ANRs on high-volume devices, cold starts beyond a few seconds on mid-tier hardware, permission prompts firing before first value, and any mandatory gate between install and the app's core action. The rest can wait a cycle.
Run the arithmetic with your own numbers. Take a cohort where 100 of every 1,000 installs survive to day 7. Triple the spend and you get 300 survivors alongside 2,700 wasted acquisitions. Waste scales as fast as budget does.
The fair counter-argument: some products need volume before retention data means anything. That holds for a young app, and stops the moment you can segment.
If you'd rather not run this in-house, an audit is a scoped engagement our mobile app development team handles inside the usual two-week delivery window, with CMMI Level 5 process behind it and 80+ engineers for device coverage. Book a slot and we'll tell you honestly whether the problem is the app or the traffic.
Frequently Asked Questions
How long does a mobile app retention audit take?
About a week for one person with the right access: analytics, Play Console, App Store Connect, and the support inbox. Getting that access approved often takes longer than the audit itself, so start there.
What counts as a good D1 or D7 retention number?
It depends on category, and any benchmark quoted without a category and a date attached is close to useless. Compare against your own past cohorts: last quarter's D7 for the same acquisition source is the only number that controls for everything else.
How many reviews do we need to read before the themes are reliable?
Read every 1-2 star review from the last ninety days if there are fewer than 300. Above that, take the last thirty days plus a random sample. The taxonomy is stable when twenty consecutive reviews produce no new theme.
Should we pause paid acquisition while we fix retention?
Reduce rather than stop. Keep enough spend running to measure whether your fixes move the cohort, since a full pause leaves no fresh data to compare against. Cut the worst-performing channel first.
What do we do when analytics and reviews disagree?
Trust the one you can reproduce. If analytics shows a clean funnel but reviews describe a failure, try it on the device model the reviews name. Usually the event wasn't firing on the path where things broke.
Have a project in mind? Let's scope it together.
You get a named team, written estimates, full code and IP ownership, and 48-hour response times. CMMI Level 5 certified. 700+ projects delivered across the UK, US, UAE, and Australia.